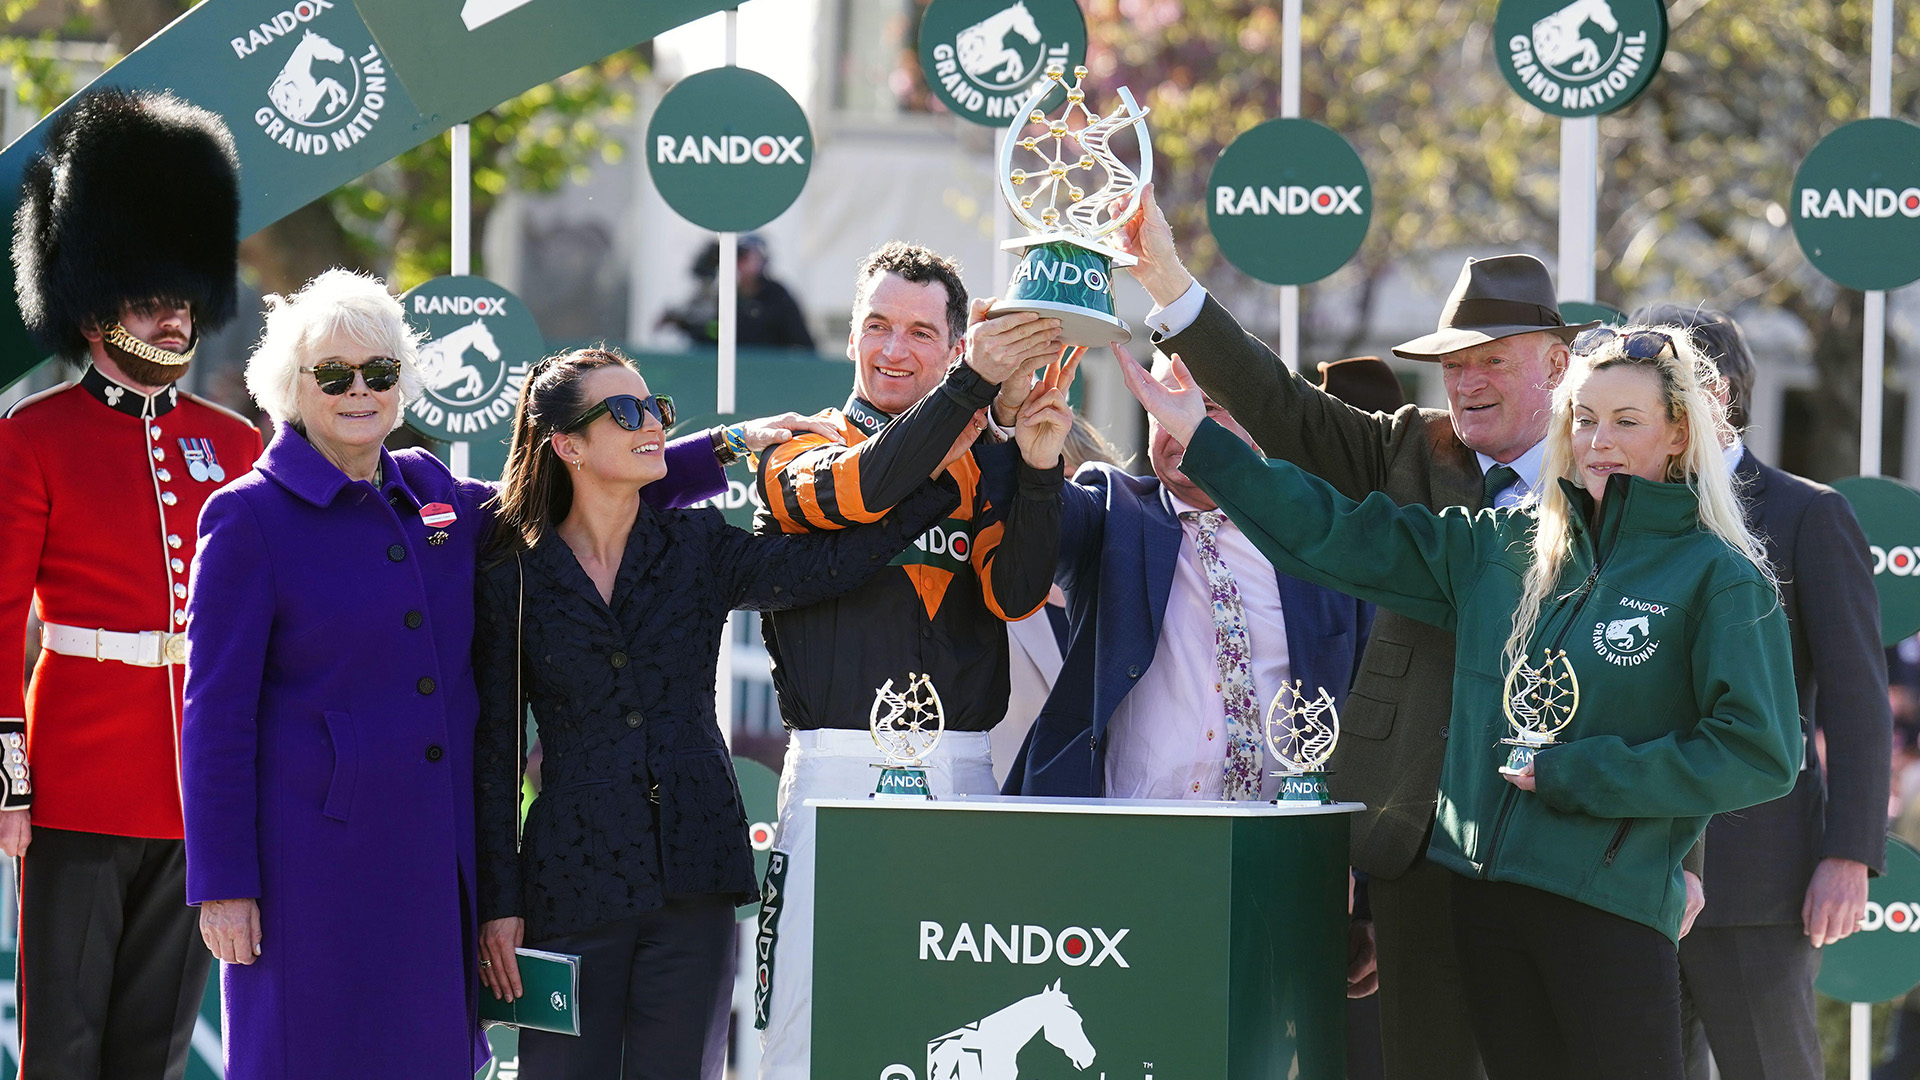
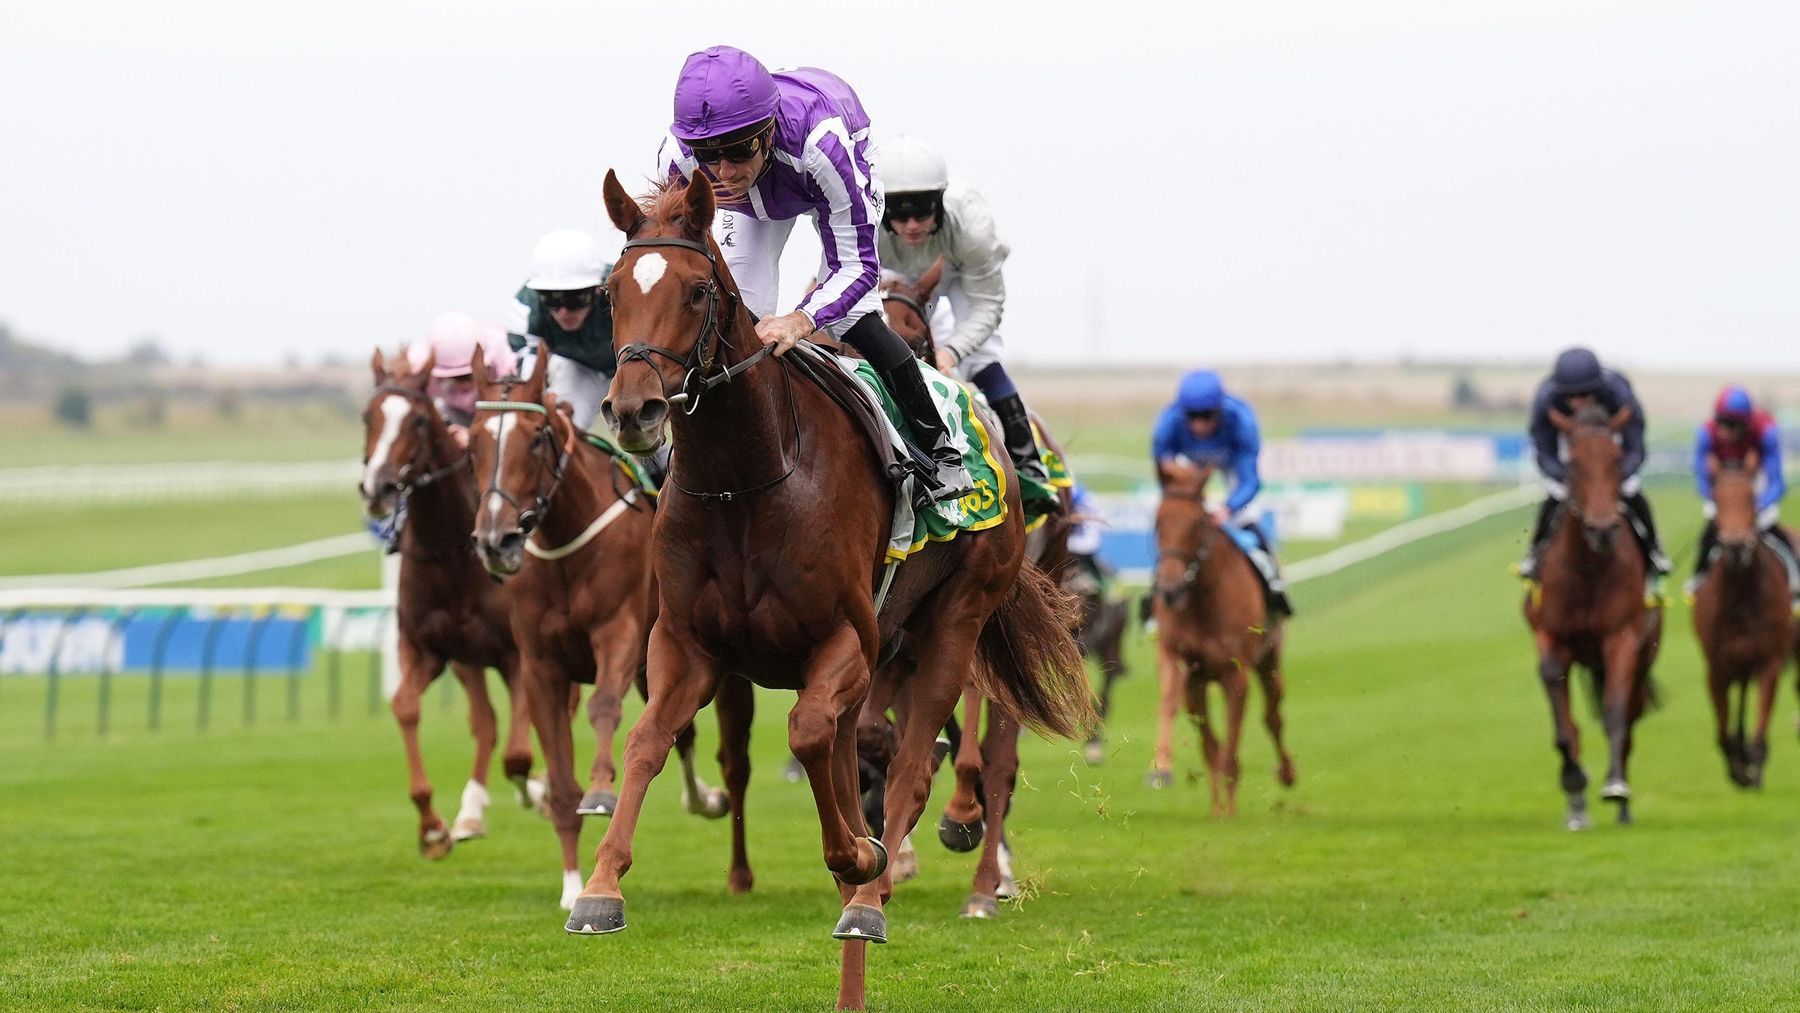
Check out our Grand National Runners A-Z Guide or our Grand National Runners hub with star ratings to help you find the horse to back.
Grand National Odds Explained
The National is unique in its depth, field size, course complexity and unpredictability, so its betting markets behave differently from standard everyday handicaps. We take a look at how you can read the different odds formats, work out your return and understand the implied probability that underpins the world of betting.
Paddy Power RACING OFFER
GET £5 IN FREE BET BUILDER BETS WHEN YOU PLACE A £10 BET ON RACING
CLAIM OFFERNew customers only. T&Cs apply. 18+.
What Do Grand National Odds Actually Represent?
Odds are simply a reflection of probability. They are not predictions, guarantees or statements of certainty. Instead, they quantify:
- How likely a bookmaker thinks a horse is to win
- How confident the market is in that assessment
- How much potential return a bettor receives for a given stake
In a race like the Grand National, with 34 runners, extreme distance and 30 fences, these probabilities are spread more widely than in typical races.
Fractional Odds Explained
Fractional odds (e.g., 10/1, 5/2, 33/1) display:
- First number: Profit
- Second number: Stake required to earn that profit
For example:
- 10/1 means you win £10 for every £1 staked (plus your £1 back).
- 5/1 means you win £5 for every £1.
- 33/1 means you win £33 for every £1.
Fractional odds remain the most common format in UK betting.
Decimal Odds Explained
Decimal odds (e.g., 11.0, 3.5, 34.0) represent the total return, including stake.
- 11.0 means you receive 11 times your stake if the horse wins.
- 3.5 means you receive 3.5 times your stake.
Converting fractional → decimal:
- 10/1 becomes 11.0
- 5/1 becomes 6.0
- 33/1 becomes 34.0
Decimal odds are clearer for calculating returns, but fractional odds remain culturally embedded in British racing.
Implied Probability: The Key to Understanding Pricing
Odds are best understood by converting them into probabilities.
For fractional odds:
Probability (%) = denominator ÷ (numerator + denominator)
Examples:
- 10/1 → 1 / (10+1) = 9.1%
- 5/1 → 1 / (5+1) = 16.7%
- 33/1 → 1 / (33+1) = 2.9%
This illustrates the core point: A large field means even the leading contenders have relatively modest win percentages.
Why Grand National Odds Are More Volatile Than Usual
The Grand National’s scale means markets often shift significantly due to:
1.Ground changes
Soft/heavy ground shortens the odds of proven stayers and drifters.
2. Field size and withdrawals
The inclusion or absence of a key front runner or proven stayer can move prices across the board.
3. Stable Form
As a trainer's other horses continue running in the lead up to Aintree, a uptick or downturn in stable form could move the price of the Grand National horse.
4. Public sentiment
This is one of the few races where significant recreational betting affects the market. This can shorten the odds of popular horses even if their underlying chance remains unchanged.
5. Course form
Any horse with previous National experience — especially a completion — often shortens without necessarily improving as a performer. These shifts do not imply certainty; they reflect market behaviour.
Understanding Each-Way Terms in the Grand National
Each-way betting matters more for the National than almost any other race because:
- The field is large
- The race is unpredictable
- Prices are often generous
Standard expected terms for the National in 2026:
- Places paid: Often 5, 6 or even 7 places depending on bookmaker
- Each-way fraction: Usually 1/5 of the win odds
Example:
If a horse is 20/1 each-way, a placed finish (1/5 odds) pays:
- 4/1 place return
Given the depth of the field and the length of the race, each-way value can exceed win value for many horses.
Why Some Horses Are Shorter Than Logic Suggests
In major betting events, prices sometimes reflect more than pure racing logic:
High-profile stables
Certain yards traditionally attract support due to reputation.
Narrative horses
Horses with compelling stories or media coverage tend to shorten.
Historical echoes
Trends such as “previous National finishers” or “second-season chasers” can shape market behaviour.
None of these are definitive predictors but they influence how the odds settle.
Longshots: Why the National Always Features Big Prices
The Grand National has produced multiple winners at:
- 33/1
- 50/1
- 100/1
This is because:
- The race is long enough for unusual scenarios
- Traffic issues affect strong contenders
- Many horses improve when faced with the National’s stamina test
- Jumping fluency varies markedly across 30 obstacles
As a result, the implied probability will always be low for many runners, allowing long odds to win without it being a statistical anomaly.
How Odds Change During Race Week
The final week typically brings:
- Market tightening as opinions become more uniform
- Late gambles on well-supported horses
- Drifts on runners with ground concerns
- Price corrections once the final 34 are confirmed
These shifts reflect new information, not guarantees.
Summary
Understanding National odds comes down to recognising:
- Odds express probabilities, not predictions
- Fractional and decimal formats tell the same story differently
- The Grand National market is unusually fluid due to field size and public betting patterns
- Longshots always retain realistic winning chances
- Prices often move in response to narrative, ground and handicapping factors
Clear thinking about probability — rather than price alone — helps contextualise the dynamics of the world’s most famous steeplechase.


.jpg)

.jpg)