You could be forgiven for thinking that IFAB had fixed the bonkers handball rule, after the early season flood of weird handball penalties was followed by a period of common sense.
Until Sunday, where the brutally harsh handball law saw penalties awarded to Leicester and Manchester City, in incidents where defenders couldn’t do much to avoid the ball hitting their arm.
With this new normal unlikely to change until the end of the season – despite the fact that even referees hate the rule – Paddy Power have created a new footballing statistic: expected handball penalties (xHBP).
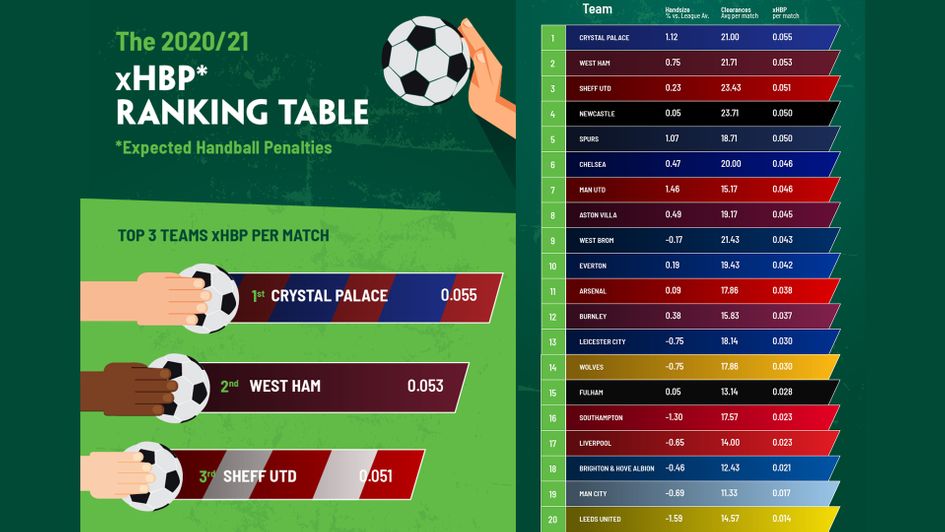
Created by analysing historical data, hand sizes, and numbers of entries into the box, the stats suggest that Crystal Palace are most likely to give away a penalty for handball – 55% more likely than the division average.
Spokesman Paddy Power said: “We thought we’d seen the end of the handball law, and just had the carnage of VAR to deal with – but the gruesome twosome were back in full flow over the weekend.
“Our analysis should at least give the world of football a new statistic to talk about, because we know how much everyone loves xG.”
The Premier League xHBP table (handball penalties per match)
- Crystal Palace - 0.055
- West Ham - 0.053
- Sheffield United - 0.051
- Newcastle - 0.050
- Tottenham - 0.050
- Chelsea - 0.046
- Manchester United - 0.046
- Aston Villa - 0.045
- West Brom - 0.043
- Everton - 0.042
- Arsenal - 0.038
- Burnley - 0.037
- Leicester - 0.030
- Wolves - 0.030
- Fulham - 0.028
- Southampton - 0.023
- Liverpool - 0.023
- Brighton - 0.021
- Manchester City - 0.17
- Leeds - 0.014
How was this calculated?
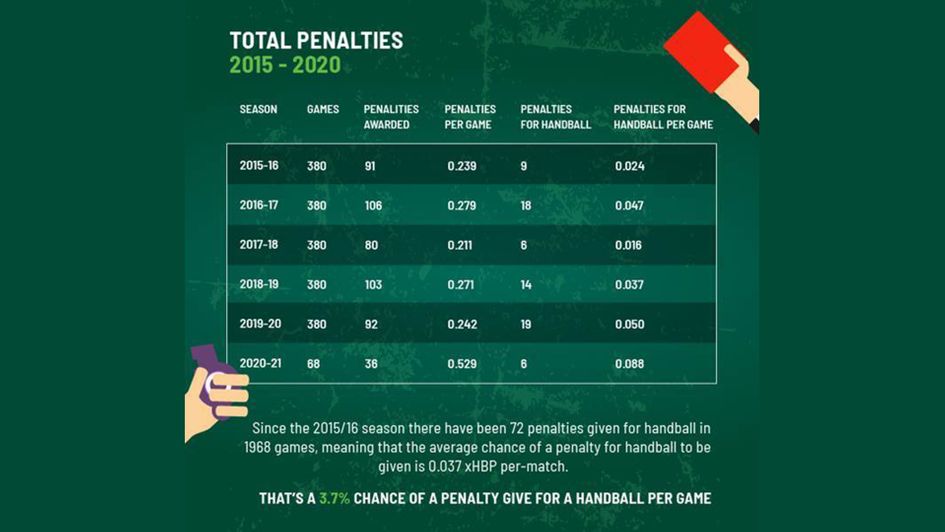
Since the 2015/16 season there have been 72 penalties given for handball in 1968 games, meaning that the average chance of a penalty for handball to be given is 0.037 xHBP per-match (3.7%).
Paddy Power divided this by the average number of clearances (18.03) made by a Premier League team during a game in the 20/21 season and gave each clearance an xHBP value of 0.002 per-clearance (0.2%)
Using each Premier League team’s average for number of clearances, they calculated the volume of xHBP they incurred each game.
Players with bigger hands and arms have a greater chance of giving away a handball penalty. So to work out which team in the Premier League had the biggest hands, they used player heights as it has been proven to be an accurate indicator of hand size.
They found the average height per active playing squad in the Premier League was 180.3cm.
Each Premier League team was then awarded a risk value based on the % of much higher or lower the average height of the active playing squad was.
By adding the risk caused by bigger hand sizes with their total for xHBP clearances, Paddy Power created the final xHBP table.